Students who use accurate visual representations are six times more likely to correctly solve math problems than students who do not. “Representing” is not just a strategy for learning content knowledge, but also a critical language connection that can help bridge the equity gap.
What if there was one highly effective, research-based instructional strategy that could engage all of your math and science students, accelerate their learning, support your multilingual and special needs students, support your struggling learners, and align with your state’s evolving academic standards? Would you use it?
That strategy is “representing,” or student-created visual representations. You likely already use this strategy in many of your lesson plans. But you may want to consider using it more broadly. This article explains why and how we can use visual representations to support all learners in both math and science content areas.
What Is “Representing?”
When one thinks of visual representations, one typically thinks of visual aids and models to provide to the student as a learning support. Visual aids and models are indeed effective tools. Every math and science educator incorporates word walls, graphs, charts, models, illustrations, and diagrams into instruction at some point. Less common, however, is the practice of having students create their own visual representations. This practice enables students to demonstrate their knowledge and to communicate their ideas. In the domain of English Language Development (ELD), we call this “representing.”
Representing is an expressive communication mode that allows learners to convey meaning by creating a visual or by augmenting an existing visual. It’s a term used in the WIDA ELD Standards Framework for multilingual learners (MLs), but it’s not limited to MLs. Representing is particularly important in math and science, where it can be a challenge to visualize data, processes, and interrelationships.
- In mathematics, a visual representation depicts a set of quantities and relationships. Imagine a student creating a pie chart and a fraction strip, both representing one-third.

- In the sciences, “representing” is critical to at least four of the scientific practices: developing models, planning investigations, arguing from evidence, and evaluating and communicating.
The purpose of having students create their own visual representations is to reflect their understanding of a problem or phenomenon and to help them correctly solve or investigate it. When students create or augment representations, they also internalize the concept. Academic standards such as CCSS and NGSS recognize this. It is, in fact, becoming increasingly common for standards to specify that the student must create their own visual model or representation in order to meet the learning objectives.
Effectiveness in Math and Science
There’s a reason for the increased emphasis on having students create visual representations. It’s effective!
- Students who use accurate visual representations are six times more likely to correctly solve math problems than are students who do not (Boonen et al., 2014).
- Researchers in a corroborating study also found that the benefits of using visual representations hold true for all students, whether or not they have a learning disability (van Garderen et al., 2012 & 2014) and whether or not they have achieved proficiency on their math assessment (Krawec, 2014).
- Bear in mind that there is no such thing as a visual learner, as opposed to an auditory or kinesthetic learner. The learning styles hypothesis was debunked over two decades ago. All students are likely to benefit from the visual representations strategy.
- Learning sciences research has found that students with learning disabilities often do not create accurate visual representations or do not use them to solve problems. But teaching students to systematically use a visual representation to solve word problems has led to substantial improvements in both math and science achievement.
- This means it’s an effective strategy, one that can be applied broadly, and one that can address gaps in the equity of opportunity and achievement.
The Critical Language Connection
Visual representations are more than learning supports for solving problems and building content knowledge. They also support communication. Representing is one of three modes of expressive language, along with speaking and writing. It’s an additional way in which students may convey their ideas, hypotheses, thought processes, solution steps, and conclusions. It’s a tool for teachers to gain insights into how a student is able to apply their content knowledge. And, representing helps students to explore interrelationships among complex math and science concepts and make connections.
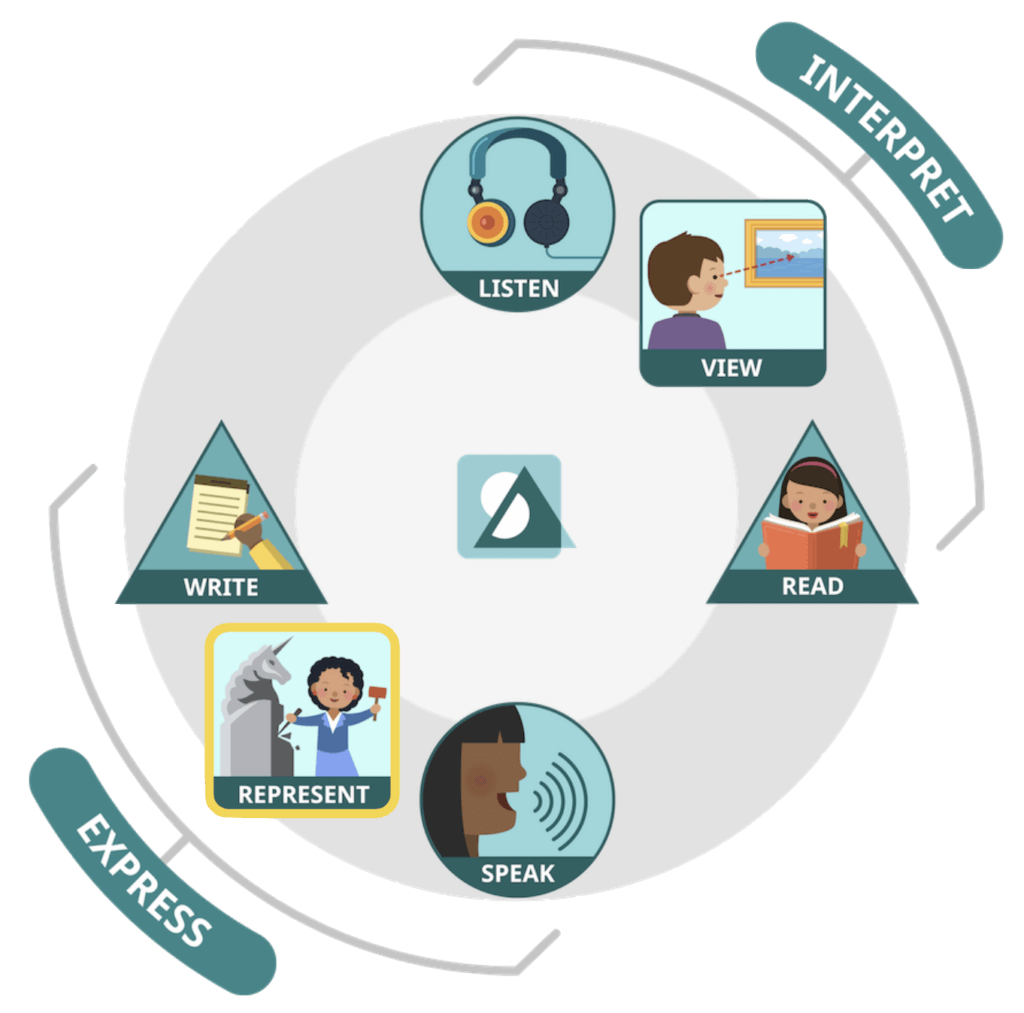
Combining the representing mode with the speaking and writing modes will improve your students’ ability to demonstrate their full breadth and depth of knowledge. The more pathways you provide for self-expression, the richer the communication can be.
Many students, particularly multilingual learners, often find it easier to convey their thoughts using a visual representation, depending on the content and the context. This explains why “representing” was added to the ELD Standards Framework in 2020 by the WIDA Consortium, which runs the ACCESS test for multilingual learners.
Alignment to Math Standards
Visual representations are increasingly finding their way into math and science standards at both the state and national levels. In my home state of Maryland, the state PreK-12 Mathematics Policy has prioritized the use of representations. And, they are expanding their use in the new Maryland College and Career Readiness Standards for Mathematics.
Now there have always been standards for representing, such as this 6th grade one since 2010: “Draw polygons in the coordinate plane given coordinates for the vertices” (6.GR.A.3) or in 8th grade “Construct scatter plots for bivariate measurement data” (8.DS.B.2). Now, however, we are seeing a lot more since the 2025 changes. Here are a few examples:
- 5th grade “Represent computations by connecting concrete models and drawings to the meaning of multiplication and division” (5.NOS.B.7)
- 7th grade “Use visual models to explain the relationship between the circumference and area of a circle” (7.GR.B.3) and “Use visual representations such as bar graphs and circle graphs to compare and interpret probabilities.” (7.DS.C.5)
As you can see, the standards are getting more prescriptive about using the representations strategy. In fact, first on the list of the new 7th grade math reasoning evidence statements for Maryland is a new directive to “use visual representations to explain mathematical ideas.”
Rather than using representations only to compute, students use them to communicate how and why relationships hold. For example, a student might use a table and a graph to explain why two proportional relationships have the same rate of change—or use an equation and a coordinate plane to justify how changing a parameter affects the shape or position of a graph. By explicitly connecting multiple representations, students strengthen their reasoning and clarify their mathematical thinking…
It’s clear that the math standards view “representing” as not only an instructional strategy, but also a communication strategy that can enhance classroom discourse. This illustrates how representing is a critical connection between math and language.
Supports Embedded in Speak Agent
In this article, we have established that creating visual representations can be a powerful means of expression. Representing must be implemented, however, within a structure and with built-in learning scaffolds. This is where the Speak Agent program shines!
Speak Agent features an activity called Drawing Board where students can create their own graphs, charts, 2-D and 3-D figures, data tables, visual models, diagrams, and much more. Alternatively, they can layer their own annotations, doodles, shapes, highlights, and data on top of existing background images that the program provides.
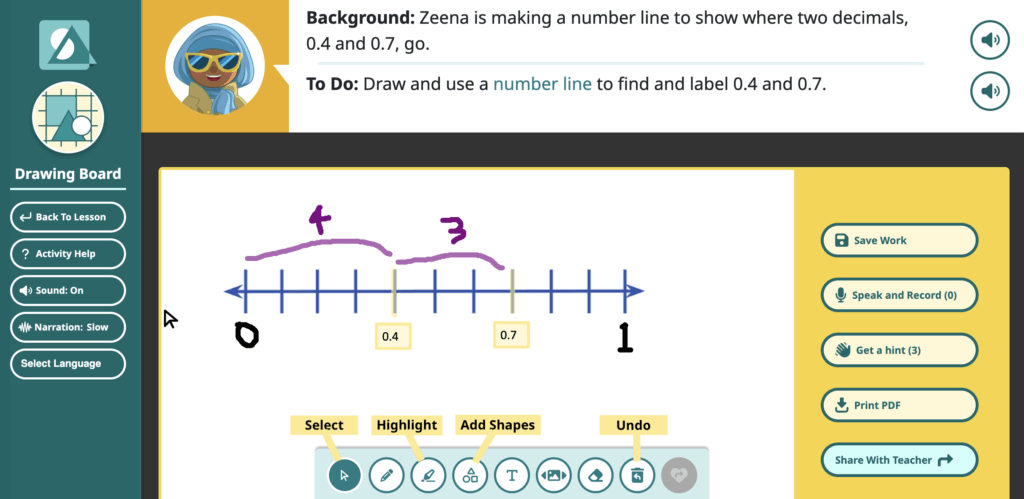
Drawing Board comes with built-in hints, a word bank, voice recording capabilities, translation and narration tools for the hints and instructions, and many other features that were ideated by level 1 and 2 multilingual learners. In fact, we co-designed Drawing Board with multilingual learners and, in testing, the pilot teachers were constantly surprised to discover how many of their level 1 and 2 students could represent complex ideas visually that they simply could not express verbally or in writing.
Students found it engaging to visually manipulate their thinking. They were able to work independently without constantly asking for help. It especially helped those learners who struggled with academic language. For teachers, the visual representations made it easier to monitor student work and to identify student errors or misconceptions. That made for more productive problem-solving conversations. It also revealed students’ diverse ways of thinking in a way that was very rewarding for the classroom teachers to see.
As we’ve integrated Drawing Board into more of our courses, we’ve had educators ask “How can I showcase model representations to my whole class? Could I see a gallery of student-made drawings to share on the projector?” The March release of Speak Agent, therefore, included a new drawings gallery. The gallery allows the teacher to view all the visual representations their students created in the Drawing Board for a particular unit or lesson on a single page, quickly cycle through them, and expand them for sharing on a projector screen. Because students are often self-conscious about their creations, the gallery hides student names unless and until the teacher decides to show them. (View a video of the gallery here.)
As more of the teachers we serve take advantage of the visual representation tools embedded within Speak Agent, it’s quite likely that those tools will evolve and expand. If you use Speak Agent, we hope to learn from you. How are you implementing this strategy? What have you observed? What’s working? What can we improve? Please contact us with your ideas and feedback.
References
Boonen, A. J. H., van Wesel, F., Jolles, J., & van der Schoot, M. (2014). The role of visual representation type, spatial ability, and reading comprehension in world problem solving: An item-analysis in elementary school children. International Journal of Educational Research, 68, 15–26.
Krawec, J. L. (2014). Problem representation and mathematical problem solving of students of varying math ability. Journal of Learning Disabilities, 47(2), 103–115.
van Garderen, D., Scheuermann, A., & Jackson, C. (2012). Examining how students with diverse abilities use diagrams to solve mathematics word problems. Learning Disability Quarterly, 36(3), 145–160.
van Garderen, D., Scheuermann, A., Poch, A. (2014). Challenges students with learning disabilities experience when using diagrams as a visualization tool to solve mathematics word problems. ZDM: International Journal on Mathematics Education, 46, 135–149. doi:10.1007/s11858-013-0519-1.
Meet with us!
Discover how we can address your unique needs and priorities!