Scenario:
You would like to view a summary of class progress over time.
How It Works:
- Go to your dashboard or to Classes & Students and click on a class name.
- Next, click the Charts tab.
- You will now see two dropdown menus with options for length of time and data type.
- Choose from 4, 8, or 12 weeks of rolling data.
- Next, choose the data type you are seeking.
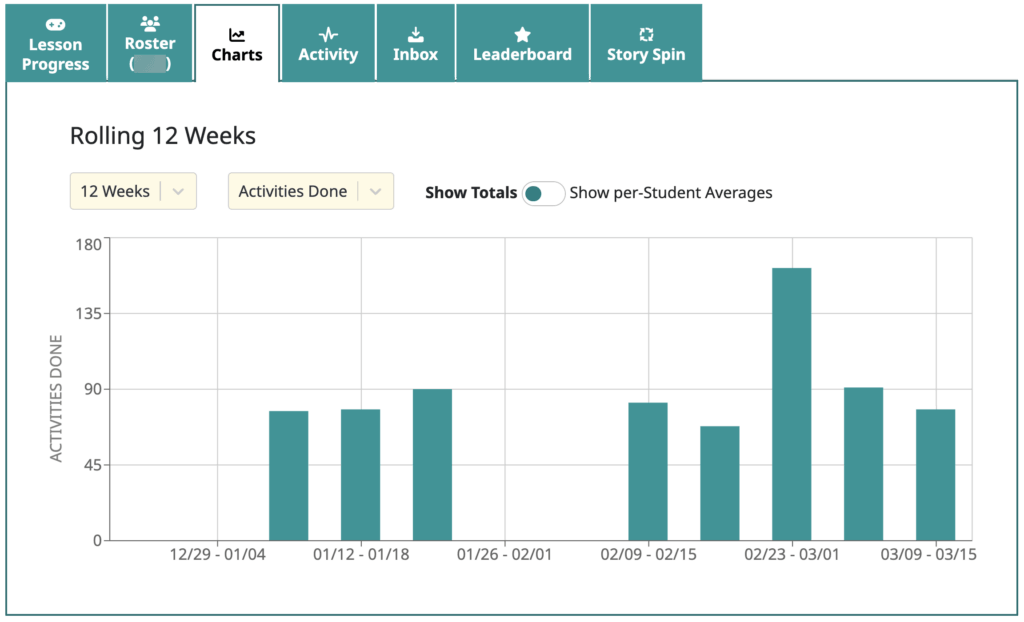
This trend chart shows Activities Done over 12 weeks:
Here’s another example showing Words Comprehended:
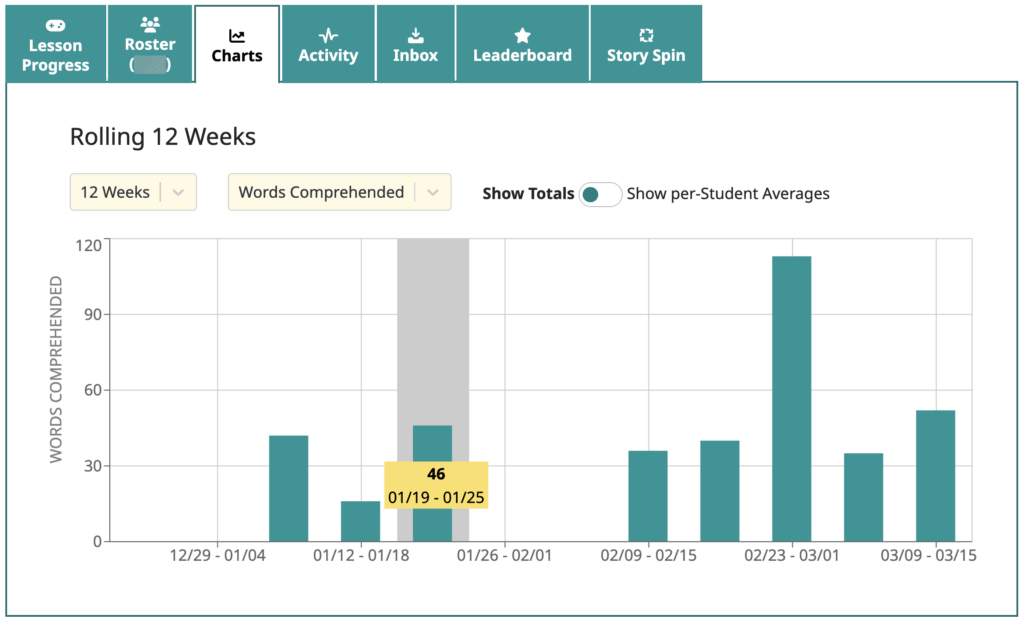
As shown above in yellow, you can move your mouse cursor over a bar on the chart to see the exact value.
Mission accomplished!